
One good day isn't progress. Patterns are.
Nutrify's analytics show your nutrition trends over days, weeks, and months, so you can see what's actually working, what's not, and where the gaps are.
The short answer
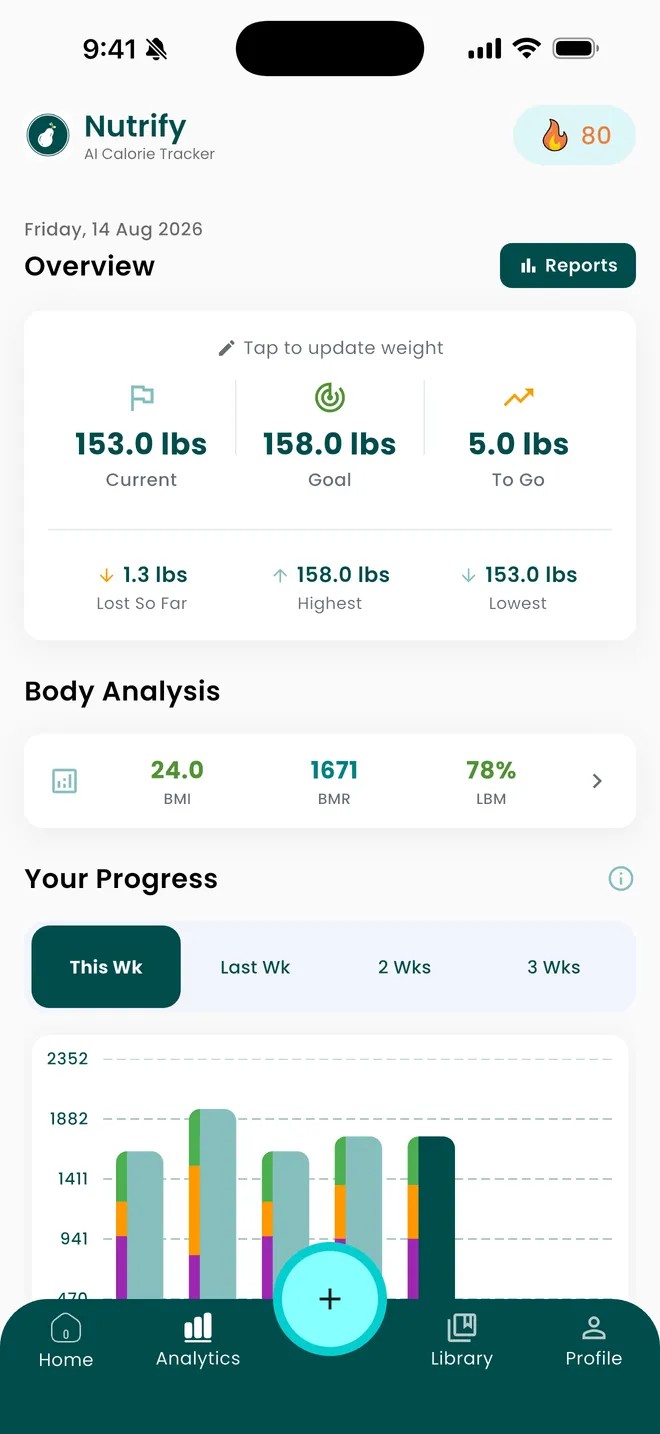
Nutrify's analytics view shows your current, goal and remaining weight, how much you have lost, your highest and lowest recorded weight, BMI, BMR and lean body mass percentage, a weekly stacked macro chart, your macro balance, your days-logged count, and a Nutrify Score trend over 7, 30 or 90 days or all time. The point is the shape of the line, which is the one thing a daily calorie ring can never show you.
Why it matters
Daily nutrition data is noise. Weekly trends are signal. If you hit your protein goal on Monday but miss it four days a week, Monday doesn't matter. The question worth asking isn't "did I eat well today." It's "am I consistently eating enough protein, fiber, and the right balance of nutrients over time?" Analytics that show you patterns over weeks and months reveal things a single day's log never could: that you consistently undereat on weekdays, overeat on weekends, rarely hit your fiber target, or get most of your carbs from a single source. That's the insight that leads to real, lasting change.
What is nutrition analytics?
Nutrition analytics is what happens to your food log after the day ends. A daily tracker answers one question, whether you hit today's numbers, and then throws the context away. Analytics keeps it, aggregates it and looks for the pattern: your average intake across a fortnight, how your macro split actually distributes rather than how you intended it to, which days consistently run high or low, and how a weight trend line moves against all of it. The distinction matters because almost nothing in nutrition is decided by a single day. Bodyweight responds to a running average of intake over weeks, and protein sufficiency is a question about your habitual diet rather than about Tuesday. Good analytics also tells you how much of your data is real, since averages taken over a partly logged month describe your logging habit at least as much as your diet.
How it works in Nutrify
Simple enough to actually do every day
Log consistently
The more days you log, the more meaningful your analytics become. Even partial logs build useful data.
Open the Analytics tab
Tap Analytics to see your nutrition data visualized over any time period.
Identify your real patterns
Spot the consistent gaps and habits that a single day's data can never reveal.
See what is actually working
Trends, heatmaps, and macro breakdowns over time
Why Nutrify specifically
Built for this, not bolted on
Weekly and monthly trend views
See any nutrient (calories, protein, fiber, sugar) trended across any time period you choose.
Nutrient gap identification
Find out which nutrients you consistently under or over consume, and by how much, so you know exactly what to fix.
Readable charts, not data overload
Clean visualizations that make your patterns clear without requiring a nutrition science degree to interpret.


The days-logged count qualifies every other number on the screen
This is the most ignored figure in any nutrition app and it should be read first. If you logged nine days out of thirty, your average daily intake is not your average daily intake. It is the average of the days you chose to record, and people skip logging on the days that went badly, so the bias runs in one direction. Nutrify puts the days-logged count in the analytics view for exactly this reason. Before you conclude that you are eating 1,700 calories a day and not losing weight, check how many days that 1,700 was calculated from. Very often the analysis stops right there.
A weekly stacked macro chart answers a different question from a daily ring
A daily ring tells you where today ended up. A stacked weekly chart tells you the shape of your week: whether protein holds up on weekdays and collapses at weekends, whether one day carries most of your carbohydrate, whether your total is genuinely steady or is an average of a famine and a feast. Stacking matters because it shows composition and volume in the same bar, so a day that hit its calories with the wrong split does not look identical to one that got it right. Bodyweight responds to the week, so the week is the unit worth looking at.
BMR is a formula output, not a measurement of you
The BMR figure in analytics is calculated from your height, weight, age and sex using a standard equation. It is a population estimate, and individuals sit either side of it. That is not a reason to ignore it, but it is a reason not to build a precise deficit on it and then be surprised. The same caveat runs through everything downstream: TDEE is BMR multiplied by an activity guess, and a deficit is TDEE minus a target. Errors compound quietly across those three steps. Use the number as a starting point, then let several weeks of actual weight data correct it, because your own trend line is better evidence than any equation.
Highest and lowest weight are there to give the trend a scale
A 1.5kg movement means something quite different depending on the range your weight normally occupies, and it is very easy to read a normal fluctuation as a reversal when you are looking at one week in isolation. Analytics shows current, goal and remaining weight next to your highest and lowest recorded values, which puts today's reading inside a range rather than on its own. It also makes plateaus legible: a fortnight of flat weight sitting well below your highest reads very differently from the same fortnight in a week where nothing else has moved either.
The Nutrify Score trend is where diet quality becomes visible
A score for one meal is a snapshot and easy to dismiss. A score trended over 7, 30 and 90 days is a habit, and habits are what analytics exists to expose. The 7-day window catches a bad week early, the 30-day window smooths out travel and illness, and the 90-day and all-time views tell you whether the changes you made in spring actually held. Because the score reflects nutritional quality rather than calories, a flat calorie trend with a rising score means the composition of your diet improved while the total stayed put, which is progress a calorie chart shows as nothing at all.
What users say
Reviews from the App Store
I've been through at least 6 food trackers and this one is the keeper. Just started GLP-1, you find out really quickly that you need to track your nutrients, and this app tracks everything I need: protein, fiber, carbs, calories, weight progress. It specifically supports a GLP-1 diet nutrient focus (gives you the choice of several other diets too). The interface is super easy, take a photo of your food, the AI nutrients estimates are very accurate. And important for GLP-1 users, it lets you adjust your meal based on actual consumption ( because you know you can never finish your whole meal).
Nutrify has been such a huge part of me getting my life back on track. I'm on a weight‑loss and diabetes journey, and for many I felt like I didn't having any direction and hoping for the best. This app finally gave me something solid to hold onto. I LOVE the analytics! It actually helps me understand my food, my numbers, and my habits in a way that makes sense to me. I can see what's helping, what is not, and what I need to adjust without feeling judged or self-conscious about it.
I am an advanced user of intermittent fasting and have tried practically all serious applications of its kind. I tried Nutrify for a while and it seems to me that they have done an excellent job and a fairly complete vision of what the habits mean that we all seek to improve our nutrition. They are doing better than many veteran Apps like LoseIt and Cronometer!
FAQ
Nutrition Analytics questions, answered
Open the analytics view in Nutrify. It shows a weekly stacked macro chart, your macro balance, weight against your goal with your highest and lowest recorded values, BMI, BMR, lean body mass percentage, your days-logged count, and a Nutrify Score trend over 7, 30 or 90 days or all time. Trends need data, so the views get useful once you have a couple of weeks of reasonably complete logging.
Roughly two weeks of mostly complete days before a weekly average is worth acting on, and longer before a weight trend separates itself from water fluctuation. The bigger issue is completeness rather than duration: thirty half-logged days produce a more misleading average than ten honest ones, which is why the days-logged count sits on the screen next to the averages.
BMR is what your body spends staying alive at rest. TDEE is that plus everything else: digestion, daily movement and exercise. TDEE is always the larger number and it is the one that determines whether you are in a deficit. Nutrify shows BMR in analytics, and the free TDEE calculator on the site takes it the rest of the way using your activity level.
It is the share of your body weight that is not fat: muscle, bone, organs and water. It is useful because two people at the same weight can have very different compositions, and because during a deficit you want the lean portion to hold while total weight falls. Like BMI and BMR, the figure is derived from a formula rather than measured directly, so read the direction of travel rather than the exact decimal.
The three usual answers, in order of frequency: the intake number is lower than reality because of unlogged days, untracked oils and rough portion estimates; the deficit was built on an estimated TDEE that does not match your body; or the fat loss is real but hidden under water retention. Analytics helps with the first two by showing how many days you actually logged and letting your weight trend correct the estimate.
Yes. The weekly stacked macro chart is the default view for a reason: bodyweight and protein sufficiency respond to weekly patterns, not to individual days. Stacking shows composition and total volume in the same bar, so a week that averaged correctly by swinging wildly does not look the same as a genuinely steady one.
Yes. Analytics shows your current weight, your goal, how much is left to go, how much you have lost, and your highest and lowest recorded values. Having the range on screen makes single readings much harder to over-interpret, since a normal daily fluctuation looks a lot less alarming when you can see the band it sits inside.
There is no single number, because it depends on your size, age, sex, activity and goal. Anyone quoting one figure for everyone is guessing. Use the free TDEE calculator to get a maintenance estimate from your own details and the calorie deficit calculator to set a target from there, then let a few weeks of weight data tell you whether the estimate was right for you.
Nutrify is free to download on iOS and Android and the analytics view is part of the app. There is a 7-day free trial of the paid tier, cancellable at any time. All of the calculators on the website, including TDEE, BMR, macros and calorie deficit, are free and need no account at all.
And you also get
Nutrition Analytics is one piece of it.
Every Nutrify user gets the full app: AI food recognition, analytics, health integrations, and everything below.
Health Score
Hitting your calorie target doesn't mean you're eating well. Nutrify's Health Score looks at your full diet (fiber, protein, sugar, micronutrients) and gives you an honest number.
Meal Logging
Most food diary apps fail because logging a meal takes longer than eating it. Nutrify flips that: photo, voice, barcode, or text, your meal is logged before you put down your fork.
Body Measurements
Weight fluctuates by 2-3 pounds day to day from water alone. Body measurements tracked consistently over weeks show what's actually changing, and how your nutrition is driving it.
Exercise Tracking
Exercise changes what your body needs. Nutrify tracks your workouts and adjusts your calorie targets automatically, so you know exactly how much to eat without under or overfueling.
Apple Health & Google Fit
Nutrify syncs with Apple Health and Google Fit so your food data and activity data live together. Your calorie targets adjust automatically based on what you actually burned.
Keep reading
Ready to try Nutrition Analytics?
Free to download. Every feature free for 7 days, and you can cancel any time.